Addressing the data
To address these questions, we have compiled and summarized many different datasets to learn more about salmon and their habitats across Alaska, including:
Escapement and harvest by stock complexes and species
- Alaska Department of Fish and Game, Division of Commercial Fisheries. 2017. Daily salmon escapement counts from the OceanAK database, Alaska, 1921-2017. Knowledge Network for Biocomplexity. doi:10.5063/F1VQ30W7.
- Alaska Department of Fish and Game, Commercial Fisheries Entry Commission. 2018. Commercial salmon harvest data, 1882-2016. Knowledge Network for Biocomplexity. doi:10.5063/F12805V3.
Extent of hatchery enhancement across regions
- Alaska Department of Fish and Game, Mark, Tag and Age Laboratory, Madeline Jovanovich, and Emily O’Dean. Annual salmon hatchery releases from the Hatchery Release Report Form, Alaska, 1952-2017. Knowledge Network for Biocomplexity. doi:10.5063/F1N014R7.
Known amount of anadromous waters in each region
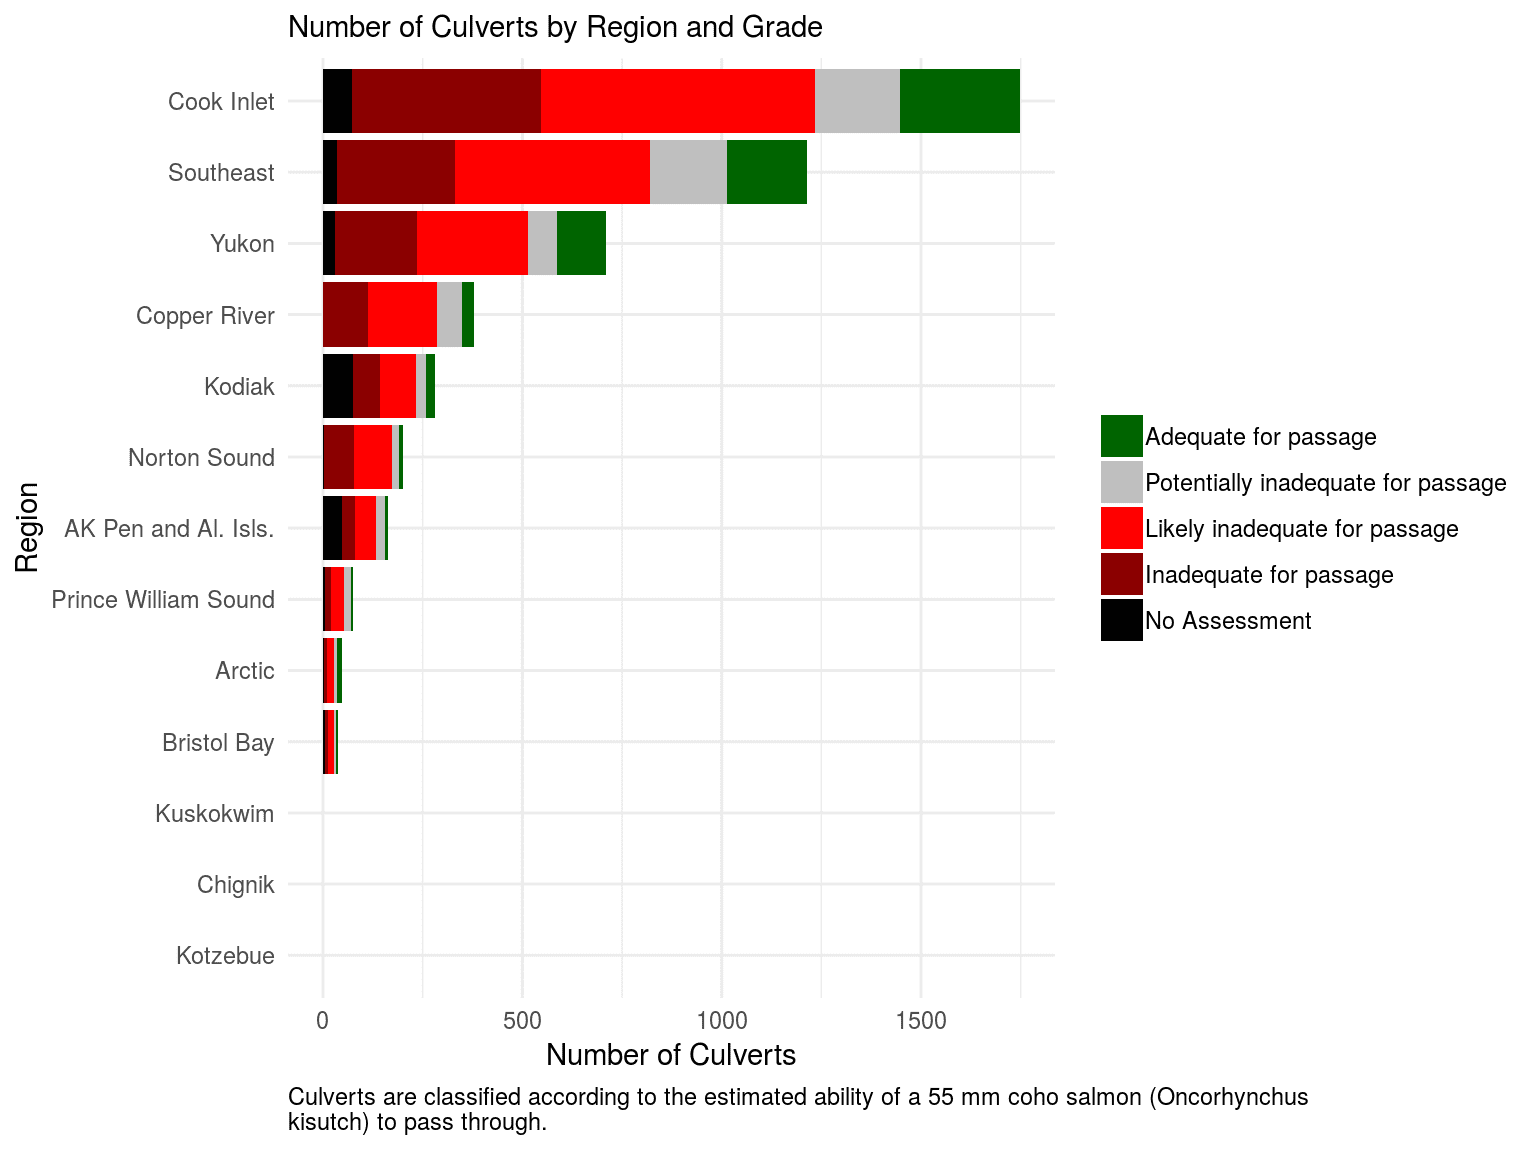
- Natural and human-influenced drivers of freshwater habitat by region (e.g. floodplain structure and channel complexity, sinuosity and slope, presence of invasive species, culvert fish passage, hydrologic drivers and land-use impacts)
- Leslie Jones, Jared Kibele, and Marie Johnson. Regional fish passage assessment, Alaska, 2000-2017. Knowledge Network for Biocomplexity. doi:10.5063/F1MW2FC2.
- Leslie Jones, Jared Kibele and Rachel Carlson. 2018. Percent landcover per SASAP region and Hydrolic Unit (HUC8) boundary for Alaskan watersheds. Knowledge Network for Biocomplexity. doi:10.5063/F1J38QR1.
- Leslie Jones, Jared Kibele and Rachel Carlson. 2018. Slope per SASAP region and Hydrolic Unit (HUC8) boundary for Alaskan watersheds. Knowledge Network for Biocomplexity. doi:10.5063/F15T3HQ1.
- Leslie Jones, Jared Kibele, Rachel Carlson, and Marie Johnson. 2018. Elevation per SASAP region and Hydrolic Unit (HUC8) boundary for Alaskan watersheds. Knowledge Network for Biocomplexity. doi:10.5063/F1Z60M87.
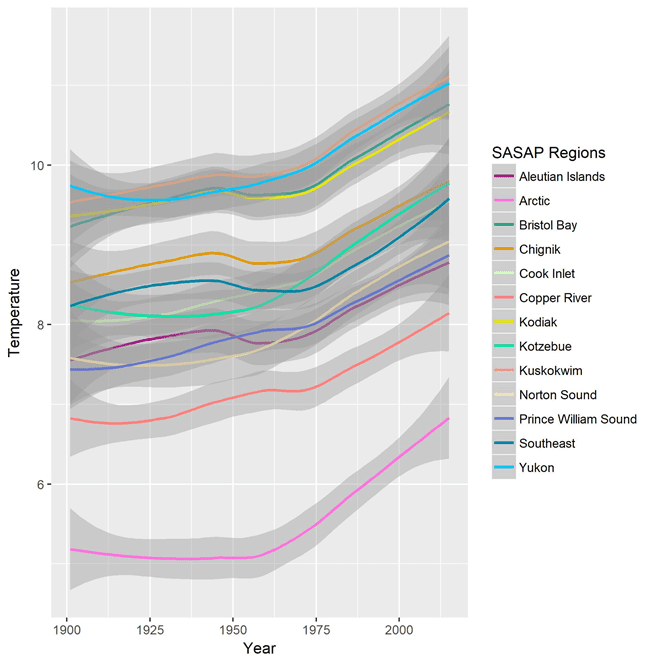
Historic and contemporary climate conditions such as precipitation and air temperatures
- Jared Kibele and Leslie Jones. 2017. Historic air temperatures in Alaska for 1901-2015, with spatial subsetting by region. Knowledge Network for Biocomplexity. doi:10.5063/F1028PSR.
- Jared Kibele and Leslie Jones. 2018. Historic precipitation in Alaska for 1901-2015, with regional subsetting by SASAP region. Knowledge Network for Biocomplexity. doi:10.5063/F1H41PP3.
Marine distribution of salmon stocks
- North Pacific Anadromous Fish Commission. INPFC/NPAFC High-seas salmonid tag-recovery database, 1956 – 2013. Knowledge Network for Biocomplexity. doi:10.5063/F18W3BJB.
- Greg Ruggerone and Jim Irvine. 2018. North Pacific salmon abundance, 1925-2015. Knowledge Network for Biocomplexity. doi:10.5063/F1CN7254.
- Changes in age and size structure of stocks within and among regions, in collaboration with the Salmon Size Working Group
- Jeanette Clark, Rich Brenner, and Bert Lewis. 2018. Compiled age, sex, and length data for Alaskan salmon, 1922-2017. Knowledge Network for Biocomplexity. urn:uuid:f2dae65b-d7c4-4d03-8e6d-2916535f04a7.
Measures of the human footprint in each region (e.g. urbanization, mining, human density)
- Jared Kibele and Leslie Jones. 2018. Global terrestrial Human Footprint maps for Alaska, 1993 and 2009, with SASAP regional subsetting. Knowledge Network for Biocomplexity. doi:10.5063/F1B856CM.
- Jared Kibele and Leslie Jones. 2018. Mines in Alaska with subsetting by watershed and SASAP region, 2010 to 2016. Knowledge Network for Biocomplexity. doi:10.5063/F1FX77P9.